
Roger Best, Chris Sataua, and Jordan Pope
|
Overview: Sports product pricing involves many considerations with regard to target consumer needs, competition, brand features, cost, desired margin, and sales. However, a key consumer consideration that is often overlooked is “What would a consumer pay for this sports product?" |
The purpose of this research paper is to demonstrate consumer-based pricing and how it impacts price, strategy, and profits. A consumer-based pricing app is included for experimenting with our sample data or creating your own consumer-based price data.
Consumer-Based Pricing
Consumer-based pricing, like consumer insight, is built around consumers who have a strong interest in a product category. Specifically, pricing is set with regard to how much these consumers would be willing to pay for a particular product. Far too often sports product companies do not include the consumer in their pricing. Instead, many companies use cost-based pricing and desired margins to set their prices. But these prices have nothing to do with what consumers would pay for the product.
To demonstrate consumer-based pricing, this paper uses the Performance model of sunglasses marketed by AthletesInsight1 and the brand story that the authors created in Exhibit I. The authors presented this brand story to 50 category consumers who had a strong interest in sports sunglasses. These consisted of 21 competitive runners, 7 competitive cyclists, 13 extreme outdoor enthusiasts (hikers, skiers, and wind surfers), and 9 former collegiate athletes. After reviewing the AthletesInsight brand story, these 50 consumers where asked one simple question:
“What is the most you would pay for these sunglasses?"

Consumer Buy Price
The consumer buy price ranged from $25 to $250, with the average at $127. To better understand the consumer buy price, Exhibit II shows the buy prices of our 50 sample consumers for ten price points from a high of $250 to a low of $25.
At the $250 price, 1 of the 50 sample consumers (2%) would buy the AthletesInsight sunglasses. At the $200 price, 6 of the 50 consumers (12%) would buy, and at the $100 price, 40 of the sample consumers (80%) would buy this product. So what is the best price to charge for these sports performance sunglasses?

Cost-Based Pricing
One approach is cost-based pricing, which is commonly used in the sports product industry. This pricing approach, as shown in Exhibit III, starts with the product cost.4 The example assumes a product cost of $20, and this leads the company to set a wholesale price at $40 to achieve a desired 50% margin. Retailers typically markup the wholesale price a 100% to a retail price of $80 to give retailers a 50% margin.

Using the consumer price curve in Exhibit II, an $80 retail price would attract an estimated 44 of the 50 sample consumers. At this volume and with a wholesale price of $40, the company would achieve $1,760 in sales as shown in Exhibit IV. With a 50% margin, the gross profit would be $880. This price strategy achieves the desired 50% margin and captures 88% of the consumers in this sample of 50 category consumers.

Consumer-Based Pricing
While cost-based pricing provides the desired margin and a large share of the sample consumers, the price that the company sets has nothing to do with the amount consumers would pay. As a result, the product could be underpriced, which would mean lower margins, or overpriced, which would translate to a lower volume sold.
An alternative approach is consumer-based pricing.4 This pricing process focuses on consumers and their needs and assessments of brand features relative to competing brand features, as shown in Exhibit V.

For each price point presented in Exhibit II, the retail (buy) price is worked backwards by first deducting retailer desired margins of 50%. In the example in Exhibit V, a retail price of $100 and a retailer margin of 50% would yield a brand wholesale price of $50. Deducting the product cost of $20 yields a brand margin of $30, a 60% margin. At the $100 retail price, the brand would attract 40 of the 50 consumers—but is this more profitable than the cost-based price of the $80 retail price that attracted a higher volume of consumers at a 50% margin?
Exhibit VI presents the price-volume-margin scenario for each of the ten price points in Exhibit II. The $100 consumer-based retail price produces a higher level of sales than the cost-based price of $80. More importantly, the gross profit is 36% higher, $1,200 as opposed to $880. Hence, the combination of a higher margin and slightly lower volume produced higher sales and higher profits.

Product-Line Pricing

The $100 price is the best price for business profits, but the consumer price curve in Exhibit II signals additional product-price opportunities. For purposes of an example, the authors created a product-line pricing strategy using the price points in Exhibit II and the comments that the authors obtained from their consumer insight research of the 50 sample consumers. The example pricing strategy that follows shows how the company can obtain still greater sales and gross profits with products positioned at three price points as performance, polarized, and value.
Performance: These sunglasses are designed for competitive runners, cyclists, and other athletes where aerodynamics is a desired benefit. The product also would come with polarized lenses. At a retail price of $150, this model should attract 34% of the sample. Assuming the cost is higher at $25, this would yield a percent margin of 67%, as shown in Exhibit VII.
Polarized: Many consumers in our sample stated they would pay more for polarized lenses. Adding this feature at the $125 price would attract the 16% of the sample buyers between $125 and $150. With a higher assumed unit cost of $22.50, this would result in a 64% gross profit.
Value: The current product with weight and fit benefits at a $100 price offer a great value relative to competing products as shown in Exhibit I. At the $100 price, the brand could capture 30% of the sample between the $100 price and the $125 price. At a unit cost of $20, this yields a 60% gross profit.
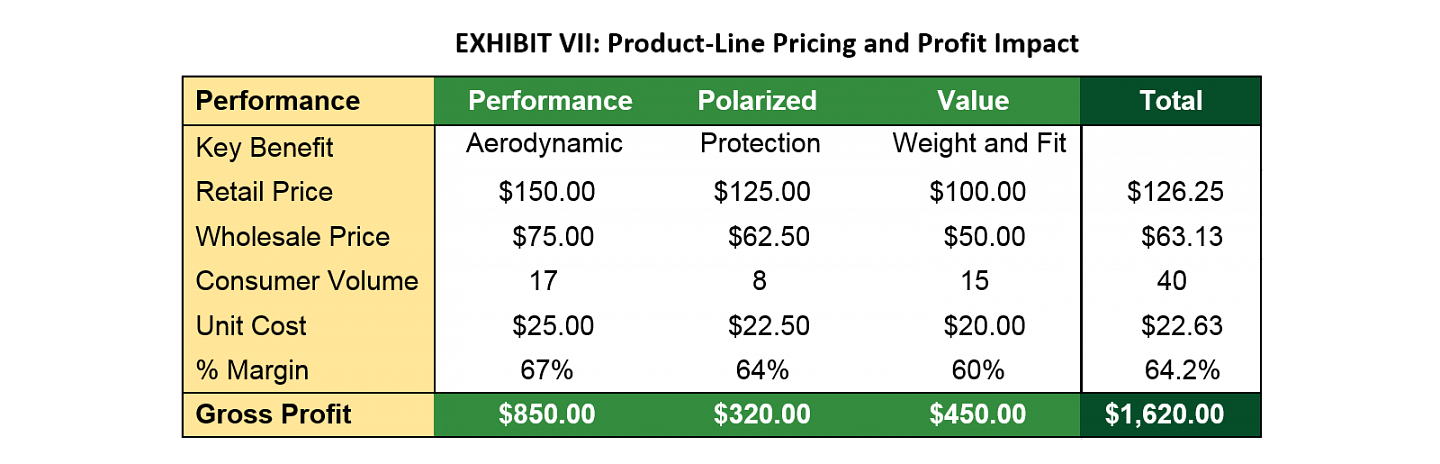
The product-line pricing strategy presented in Exhibit VII allows the company to capture higher margins along three price points on the consumer price curve. While still attracting 40 of the 50 sampled consumers, the company is able to improve its overall margin from 60% with a single product-price position to 64.2% with differentiated products at three price points. Of course, both these consumer-based price strategies produce a high margin and gross profit than the cost-based strategy.
Summary
Cost-based pricing sets a floor price for desired margins. Consumer-based pricing checks to see if consumers would value the product at a higher price, which would yield a higher margin and higher brand gross profit.
Using consumer input on the amounts that consumers would be willing to pay, a company can create a consumer price curve. This array of buy prices and consumer volume enables the company to find the combination of volume, price, and margin that would produce the best opportunity for profits. The consumer price curve provides additional consumer insights that can be used to build a product-line price strategy that captures higher overall margins than a single product-price position.
We would like to extend a special thank you to Rich Stead, founder of AthletesInsight, for his feedback in writing this Sports Product Management research paper.
Consumer-Based Pricing App
|
Citations
- “ATHLETESINSIGHT: Performance Sunglasses, Redefined," https://www.kickstarter.com/projects/athletesinsight/athletesinsight-performance-sunglasses-redefined (accessed Feb. 16, 2018).
- Ibid.
- RunnerClick, “10 Best Running Sunglasses Reviewed in 2018," https://runnerclick.com/best-running-sunglasses-reviewed/ (accessed Feb. 16, 2018).
- Roger Best, Market-Based Management, “Value-Based Pricing and Pricing Strategies," Pearson Publishing, 6th ed. (Upper Saddle River, N.J., 2012), Chapter 8, 269-272.
Authors
Roger Best is a professor emeritus in marketing at the University of Oregon and author of Market-Based Management. He is a cofounder of the University of Oregon Sports Product Management program and director of sports product management research. Roger has a BS in electrical engineering, an MBA, and a PhD in marketing. He started his career at General Electric in engineering and product management and then went on to be a Fortune 100 marketing consultant and UO marketing professor.
Chris Sataua is a product-market manager at Revant Optics in Portland, Oregon, and a 2017 graduate of the University of Oregon Sports Product Management program. He holds a BA in comprehensive design from the University of California at Davis and has 10 years of experience in design and marketing.
Jordan Pope is a a recent Master of Science graduate in the University of Oregon Sports Product Management program. He holds a BS degree in economics and a bachelor of business administration in finance from Eastern Washington University. In the summer of 2017, Jordan was the product intern at Revant Optics in Portland, Oregon.
The University of Oregon Sports Product Management program's mission is to be the worldwide leader in sports product management education and research. Online sports product research papers are a part of the research portion of the SPM mission.