Roger Best, John McPhee, and Andrew Hamburg
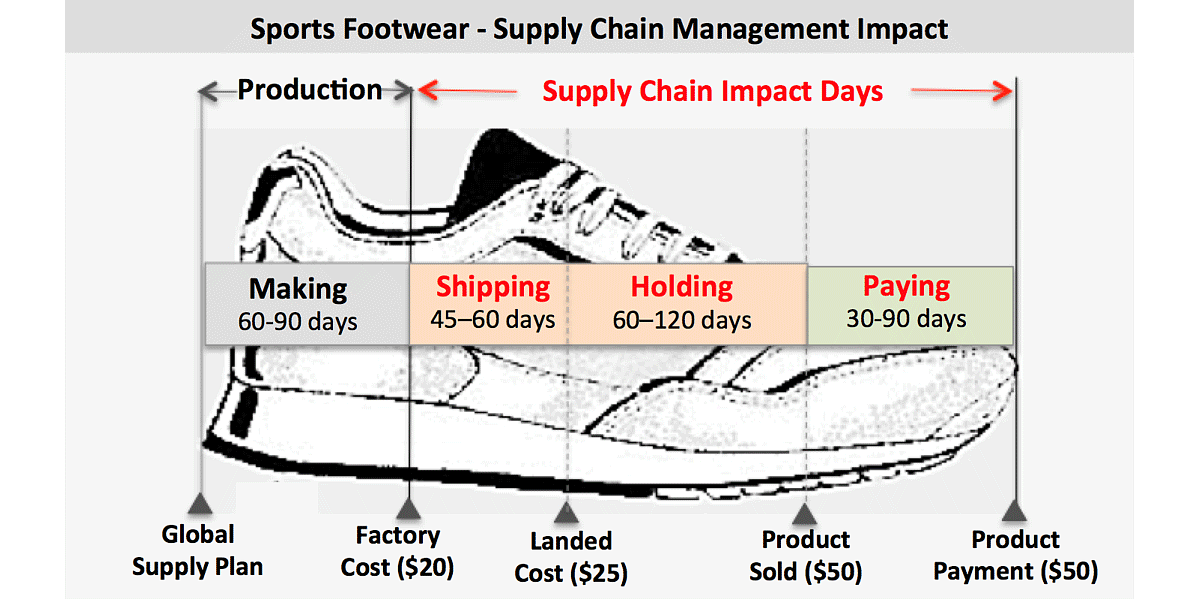
EXECUTIVE SUMMARY: While much has been written about supply chain management and profitability, there are very few empirical studies that quantify this relationship. In this paper, we used the most recent financial reports for 23 publicly traded sports product companies to quantify this relationship. We found that there is indeed a strong, definitive relationship between Supply Chain Impact Days, as defined in the diagram below, and Return on Assets.
In our study, we expanded the impact of supply chain management to include getting paid, Accounts Receivable, because a failure to deliver on-time, as ordered, impacts the speed at which retailers pay their invoices. For the sports product companies we studied, Supply Chain Impact Days (SCID) ranged from 100 days to 267 days. We found that the number of Supply Chain Impact Days (SCID) had a strong correlation (.82) with company Return on Assets (ROA), which ranged from -6.5% to 20.3%.
To illustrate our measurements and results, we used Skechers as a sample company. This paper also includes a UO Sports Product Management Program App for companies who would like to benchmark their performance relative to our database of 23 sports product companies.

Supply Chain Impact
Superb product design, with outstanding marketing and merchandising, is essential to the success of any sports product. But nothing happens without the product delivered to customers on time, as ordered.
The impact of the supply chain management on profits starts to become measureable when a company takes ownership of a sports product, which is typically in Asia. From there, products are transported, sorted and inventoried for distribution to retailers and other market destinations. Once the product is sold, supply chain management has completed its job with the exception of reverse logistics. In most cases, collecting payment from customers is someone else's responsibility. However, if the company's supply chain fails to deliver on-time, or delivers damaged or defective products, or incorrect assortments and/or quantities and/or has incorrect labeling and/or invoicing, then a supply chain management failure occurred. This failure would likely cause retailers to take longer to pay for purchased merchandise and increase Accounts Receivable and a company's investment in assets.
Exhibit I: Skechers Financial Performance

Some of these delivery errors are not caused by supply chain management. However, supply chain management is at the company-customer interface where the problem is recognized and must be resolved. While much more goes into late payment and higher Accounts Receivable Days, we believe supply chain management can play a bigger role in this process. For that reason, we have defined Supply Chain Impact Days (SCID) and its influence on Return on Assets (ROA) in the following way.
| Supply Chain Impact Days | = Inventory Days | + Accounts Receivable Days |
To evaluate the relationship between Supply Chain Impact Days and Return on Assets we must define supply chain metrics needed to quantify a measure of Supply Chain Impact Days. To better understand these performance metrics, we used Skechers and the financial data presented in Exhibit I.
Inventory Turnover: To measure inventory days, we start with inventory turnover. This is computed as the Cost of Goods Sold divided by Inventory. For Skechers, its Inventory Turnover for the financial period studied was 2.77. This means that Skechers turns over its inventory of $620 million 2.77 times per year.
| Skechers Inventory Turnover | = Cost of Goods Sold / Inventory Assets |
| = $1723 million / $620 million | |
| = 2.77 |
Inventory Days: Inventory Days is how many days it takes for a company to turn over its inventory. This metric is computed as the Number of Days in a year divided by Inventory Turnover. For Skechers, Inventory Days were 132.
| Skechers Inventory Days | = 365 days / Inventory Turnover |
| = 365 days / 2.77 | |
| = 132 days |
Accounts Receivable Days: This is the money owed to the company from retailers after merchandise is delivered and sold to retailers. Accounts Receivable Days is Accounts Receivable divided by Sales and that result is then multiplied by the number of days in the year. For Skechers" most recent financial reporting this was computed to be 45 days.
| Skechers Accounts Rec. Days | = Accounts Receivable / Sales x 365 days |
| = ($390 million / $3160 million) x 365 days | |
| = 45 days |
Supply Chain Impact Days: In this study, we defined Supply Chain Impact Days (SCID) as the number days from taking ownership of a sports product to the time a company gets paid for that product. For Skechers, its total Supply Chain Impact Days (SCID) was 177.
Exhibit II: Data - 23 Publicly Traded Sports Products Companies

| Skechers Supply Chain Impact Days | = Inventory Days | + Accounts Receivable Days |
| = 132 days | + 45 days | |
| = 177 days |
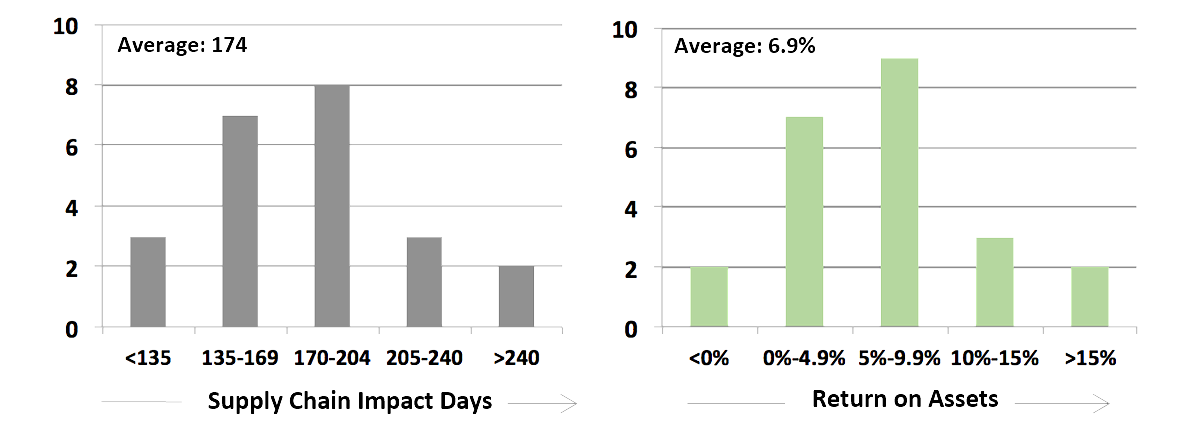
Skechers is one of the 23 companies in this study. For these 23 companies, Supply Chain Impact Days ranged from 100 to 267 as displayed in Exhibit II. As shown, there is a considerable range of Supply Chain Impact Days. The question is:
Does this variance in Supply Chain Impact Days have a meaningful impact on Return on Assets?
Return on Assets: To assess profit impact, we selected Return on Assets because it includes both Net Income from the Income Statement and Total Assets from the Balance Sheet. The distribution of Return on Assets for the 23 sports product companies studied is shown in Exhibit II and ranged from -6.5% to 20.3%, with an average of 6.9%.
Exhibit III: Supply Chain Impact Days (SCID) vs. Return on Assets (ROA)

Exhibit IV: Performance Profiles

Supply Chain Impact Days vs. Return on Assets
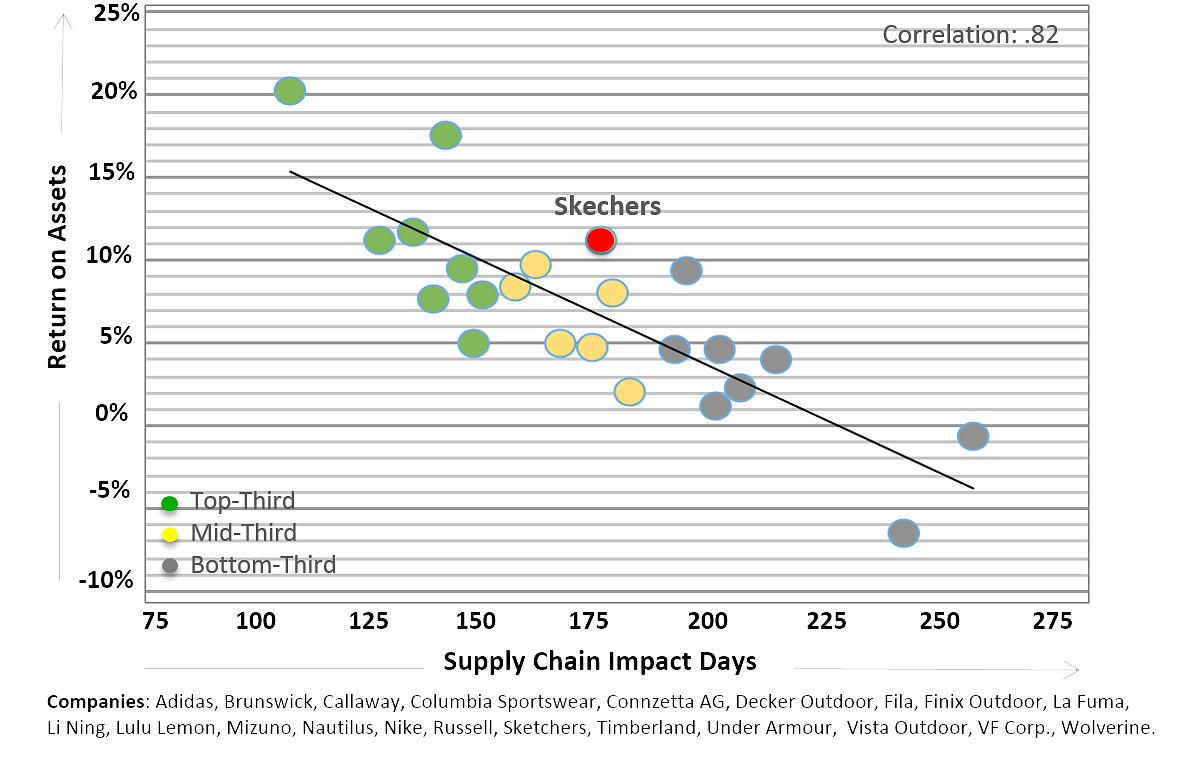
A definitive and strong relationship (correlation .82) between Supply Chain Impact Days (SCID) and Return on Assets (ROA) for 23 well-known sports product companies is shown in Exhibit III. While not a perfect correlation of 1.0, it is clear that companies with a lower number of Supply Chain Impact Days had a higher Return on Assets than companies with a higher number of Supply Chain Impact Days. Exhibit III is color coded to highlight the top, middle and lower thirds in Supply Chain Impact Days and corresponding levels of Return on Assets.
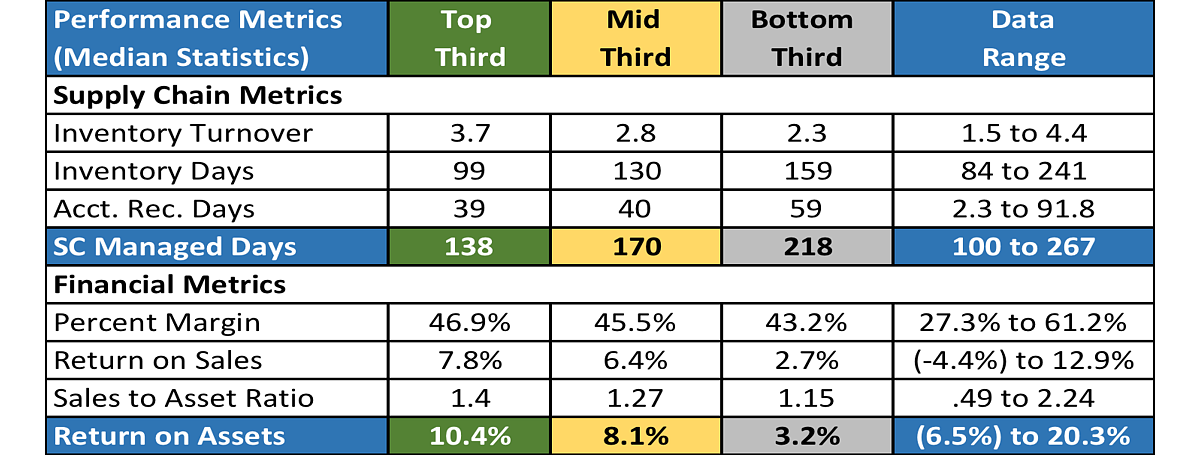
In Exhibit IV, we expanded each profile to include a deeper look at supply chain management metrics and profitability metrics. It is important to note that companies in the top-third in Supply Chain Impact Days also had a higher:
- Percent Margin (median of 46.9%)
- Return on Sales (median of 7.8%)
- Sales to Asset Ratio (median of 1.4)
Supply chain and financial performance metrics for the top-third were higher than those for the middle third which were, in turn, higher than those for the bottom third. Because supply chain management directly impacts sales, margins and inventory and indirectly impacts Accounts Receivable, it is important to realize that the Return on Assets of top performers was the result of all these factors as well as other factors not considered in this study.
Our definition of Supply Chain Impact Days (SCID) extended beyond the normal scope of supply chain management to include Accounts Receivable. The reason for including Accounts Receivable is that longer payment is often the result of a supply chain failure due to missed or late delivery, wrong assortment, under-order, over-order, damaged goods or invoicing errors. We believe supply chain management has the potential to play a larger role in managing the customer-company interface and lowering the Accounts Receivable Days and consequently increasing Return on Assets (ROA).
SUMMARY: Using financial data from 23 well-known sports product companies, we have demonstrated that there is a strong relationship (.82 correlation) between Supply Chain Impact Days (SCID) and Return on Assets (ROA). Companies with a lower number of Supply Chain Impact Days had a higher Return on Assets than companies with a higher number of Supply Chain Impact Days.
Authors:
Roger Best is cofounder of the UO Sports Product Management Program and Director of SPM Research. He is a UO Emeritus Professor in Marketing and author of Market-Based Management. Roger has a BS in Electrical Engineering, MBA and Ph.D. in Marketing. He worked in engineering and product management at GE and for 30 years as a marketing consultant to numerous Fortune 100 companies.
John McPhee is Program Lead - Supply Chain University at Nike and was previously Director of Nike North America Supply Chain Delivery. John holds Masters degrees in Business Administration and Applied Economics from Stanford University, Applied Science from the University of New South Wales and Education from Marylhurst University.
Andrew Hamburg is Business Planner for U.S. Team Sports at adidas. Andrew holds a Masters degree in Sports Product Management from the University of Oregon and a Bachelors degree in Economics from Colorado College.

